
It is a great pleasure to welcome Michell Zappa here; we have been working with him and exchanging ideas for many years. You can follow the development of the Radar product indirectly on the deftech programme page, if only to get an idea of the product’s current status.
Our concept of « future” takes on many forms, depending on who you ask. One frequent characteristic in group efforts for making sense of the future is the importance of signal collection. Signals can focus on different aspects of the future, such as technological, social or political change – and can be analyzed according to multiple measures.
Data visualization transforms complex technological data into accessible, engaging formats, crucial for translating trends and observations about ongoing change into strategic foresight for organizations of all kinds. It simplifies the interpretation of vast and intricate data, facilitating more democratic access to information.
- Future perception varies, highlighting signal collection’s importance in understanding technological, social, and political shifts.
- Data visualization is key for accessible, strategic analysis of complex data, enhancing foresight in various organizations.
- As an essential interpretive skill, data visualization is crucial for navigating and understanding dynamic, data-rich environments.
- It provides a collaborative platform for different expertise levels, aiding in scenario exploration and strategic planning.
- Data visualization fosters active engagement, vital for informed decision-making in rapidly evolving technological sectors.
We believe data visualization is rapidly becoming a crucial skill in today’s data-rich environment. It acts as a crucial interpretative mechanism, essential for decoding diverse signals and cues in the changing landscape. This clarity is vital for charting paths into possible futures.
Data visualization serves diverse expertise levels, creating a common interpretative platform for analysts and decision-makers to work together. Its interactive nature is particularly valuable in foresight, allowing exploration of various scenarios and aiding in strategic preparation for potential futures.
Visualization can inspire action. By engaging users, it transforms us from passive viewers to active participants, encouraging informed decision-making. This aspect is critical in rapidly evolving fields like emerging technology, where understanding and quick action are key to innovation.
Data visualizations for signal collection can be used for a variety of applications.
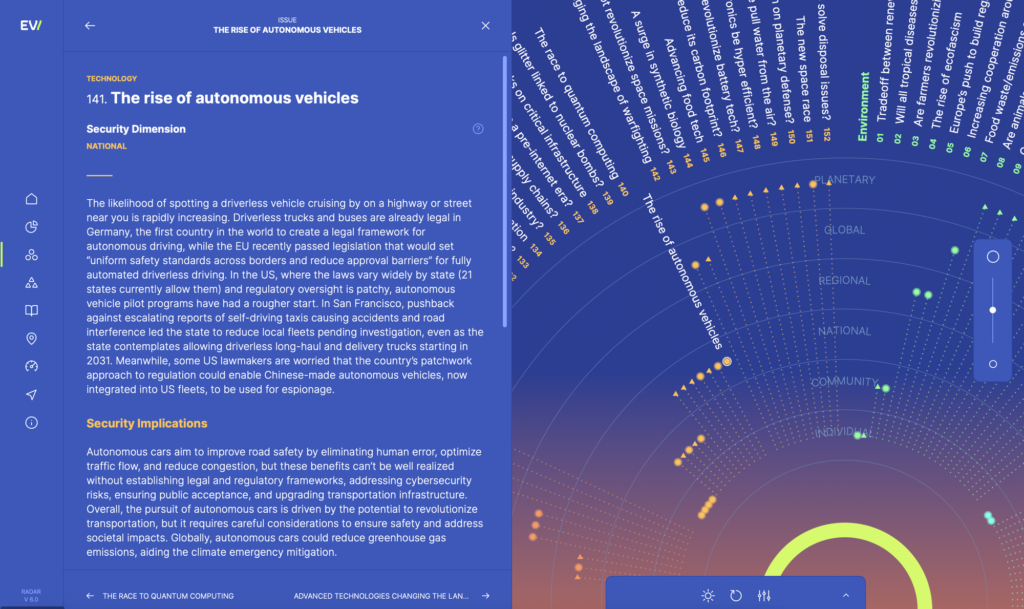
For example, worked closely with the Horizon 2045 project to help them organize signals of change with the School of International Futures. Their participatory foresight process is used to collect horizon scanning observations in the dynamics changing the future of security.
These signals are presented with various kinds of metadata, such as the expected scale of security dimension, as well as strength of signal.
⇨ Navigate the Horizon 2045 Radar
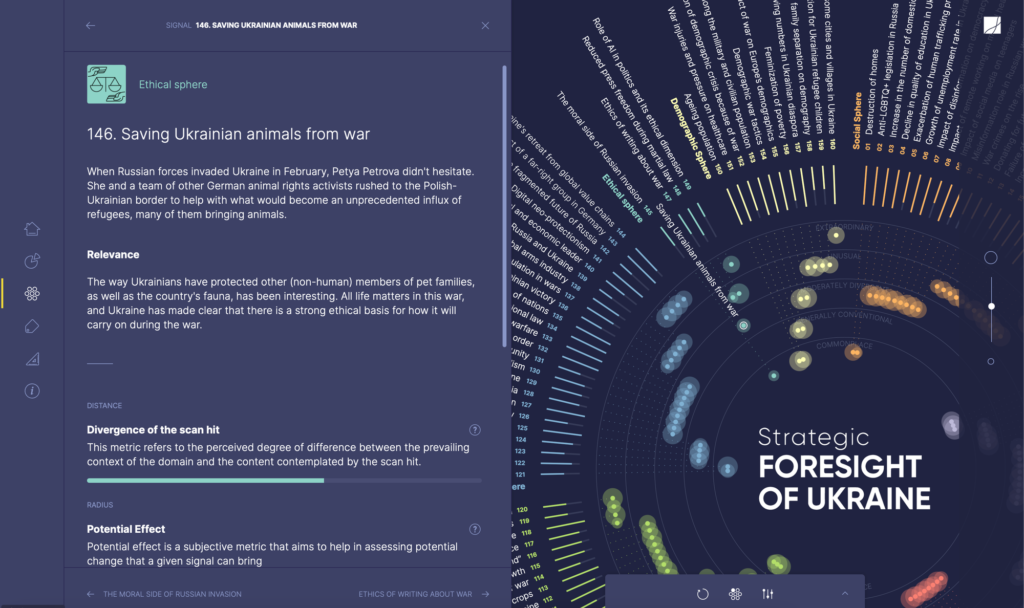
For the Strategic Foresight group at the Parliamentary level of Ukraine, together with a team of futures intelligence signal scouts and foresight experts, we helped organize and visualize hundreds of signals of change likely to affect the future of Ukraine.
Signals from different spheres including social, technological, economic, political and more were considered, and each signal was assessed according to its likely potential impact and likelihood.
Each aspect of the visualization was carefully selected to represent a crucial component of the foresight research process, and represented through an interface which facilitates the assimilation of complex data by various stakeholders.
⇨ Navigate the Strategic Foresight of Ukraine Radar
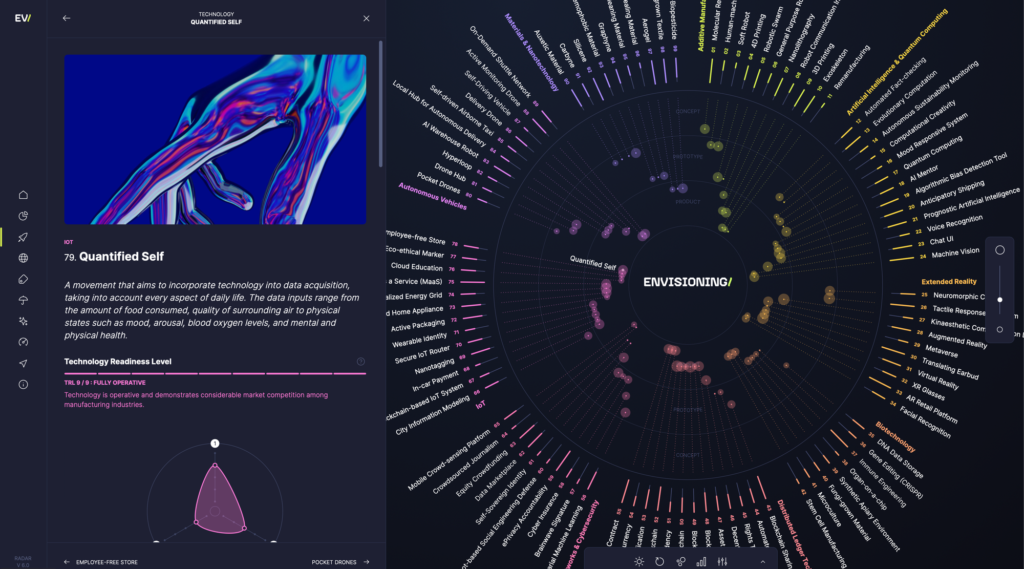
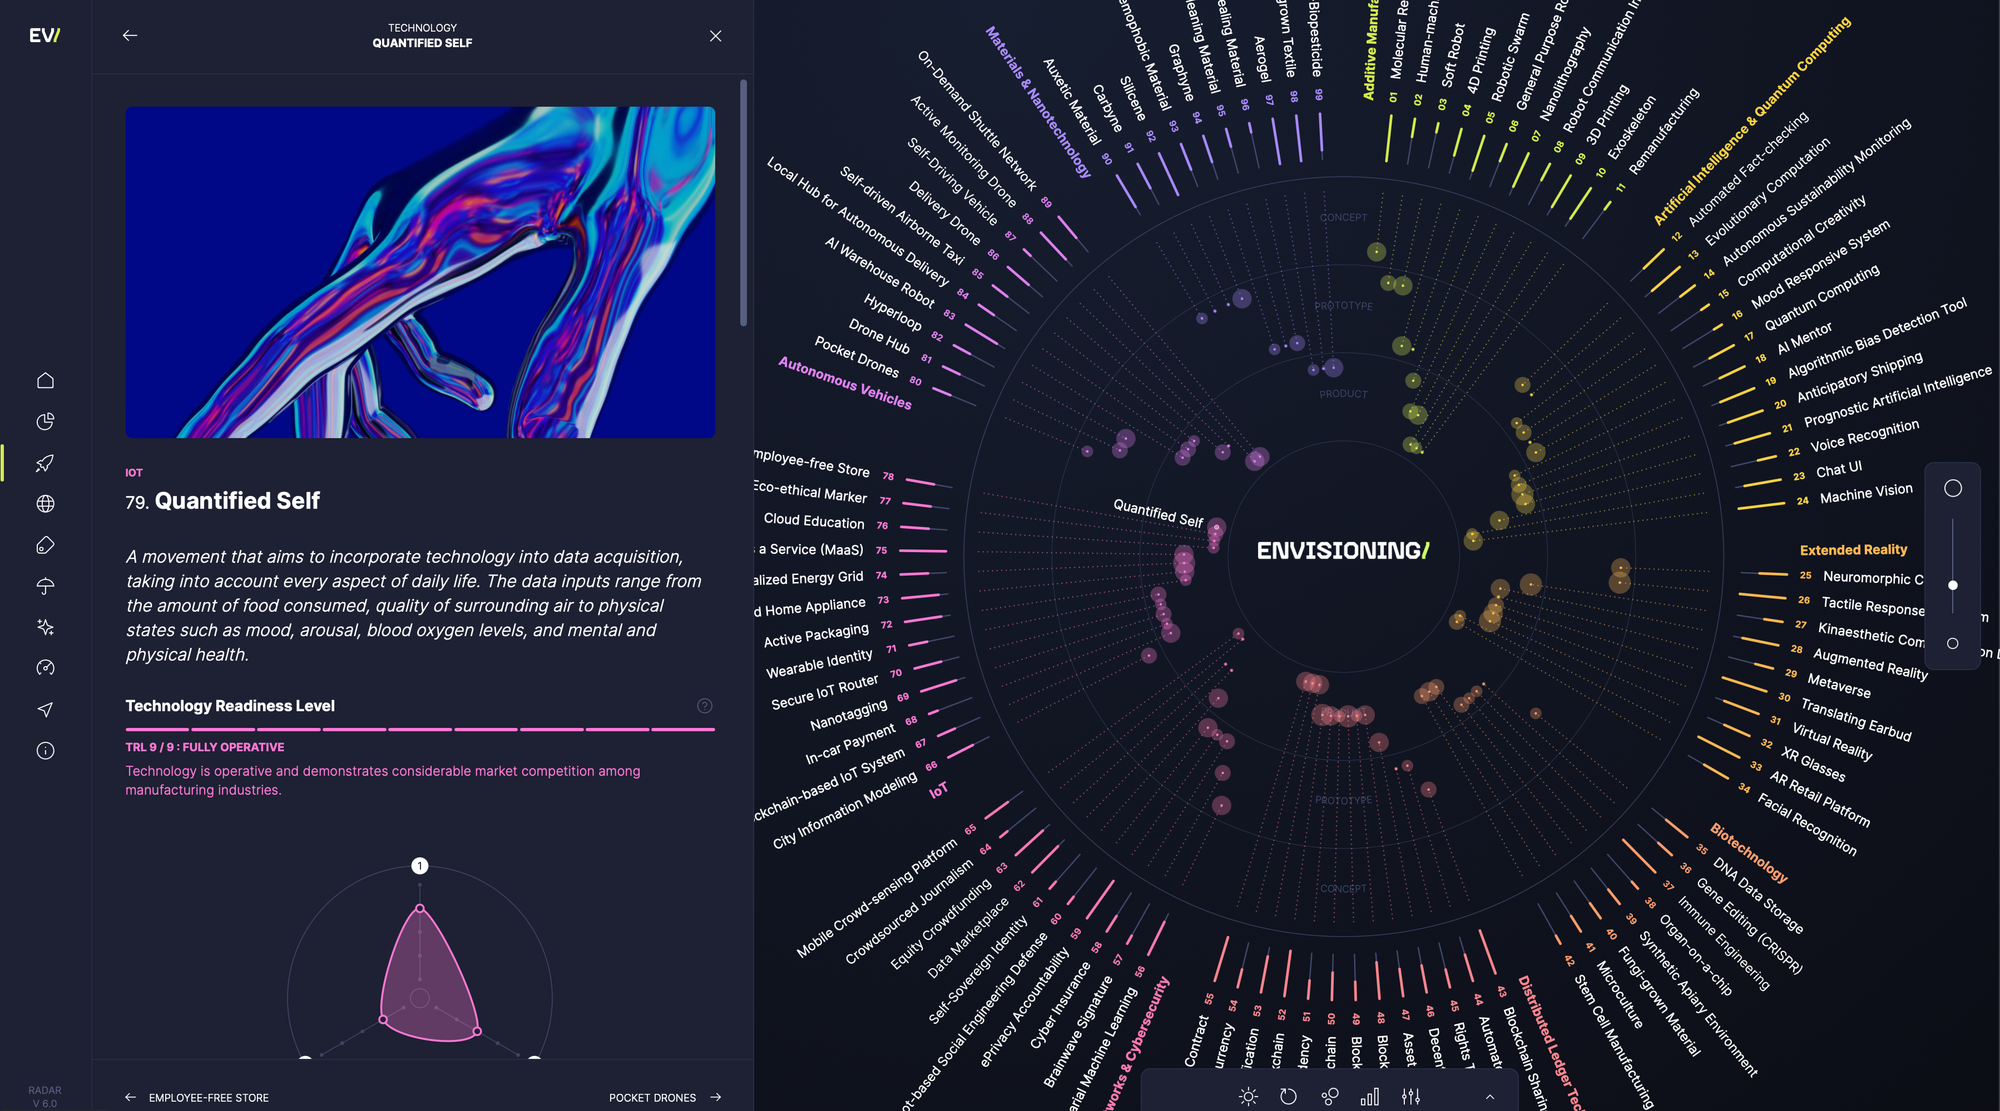
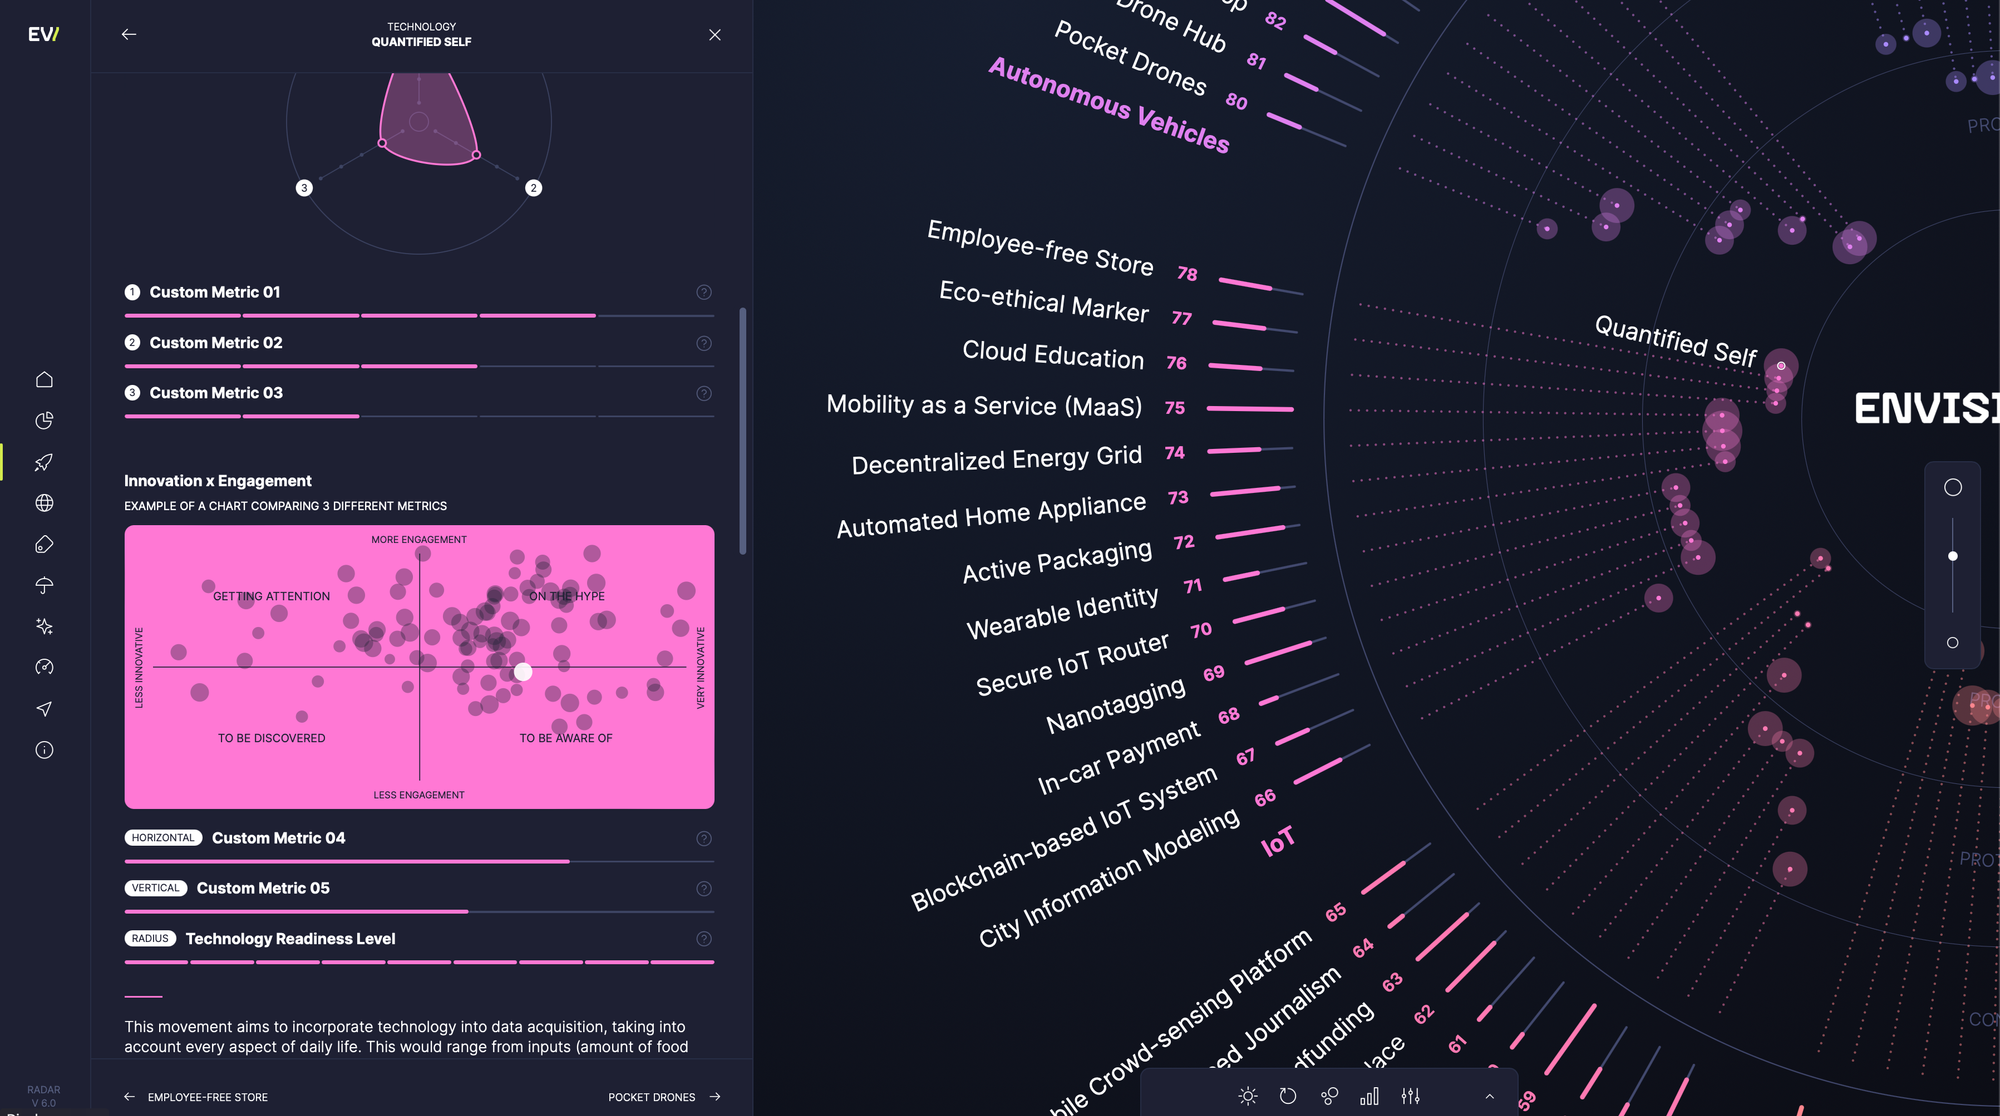
At Envisioning, our Radar interface leverages many of these principles and assists users in navigating complex data sets. Our research focuses on the impact of emerging technology on many aspects of the future. We track many measurable aspects of technology signals, and work with organizations in mapping potential futures.
Data visualization is more than a tool. It is a necessary element and skill in both comprehending present data as well as shaping future outcomes.
As we navigate through changing technological landscapes, its role in making sense of complex information and preparing for what lies ahead is increasingly crucial.